As older Americans continue to remain in their homes longer, the combination of the aging-in-place trend and 14 years of sustained house price appreciation has driven homeowners’ equity to record levels—nearly $35 trillion, according to the Federal Reserve. This week’s MBA Chart of the Week examines one way seniors can access that housing wealth while continuing to age in place by analyzing reverse mortgage originations from 2018 through 2025 using Home Mortgage Disclosure Act (HMDA) data.
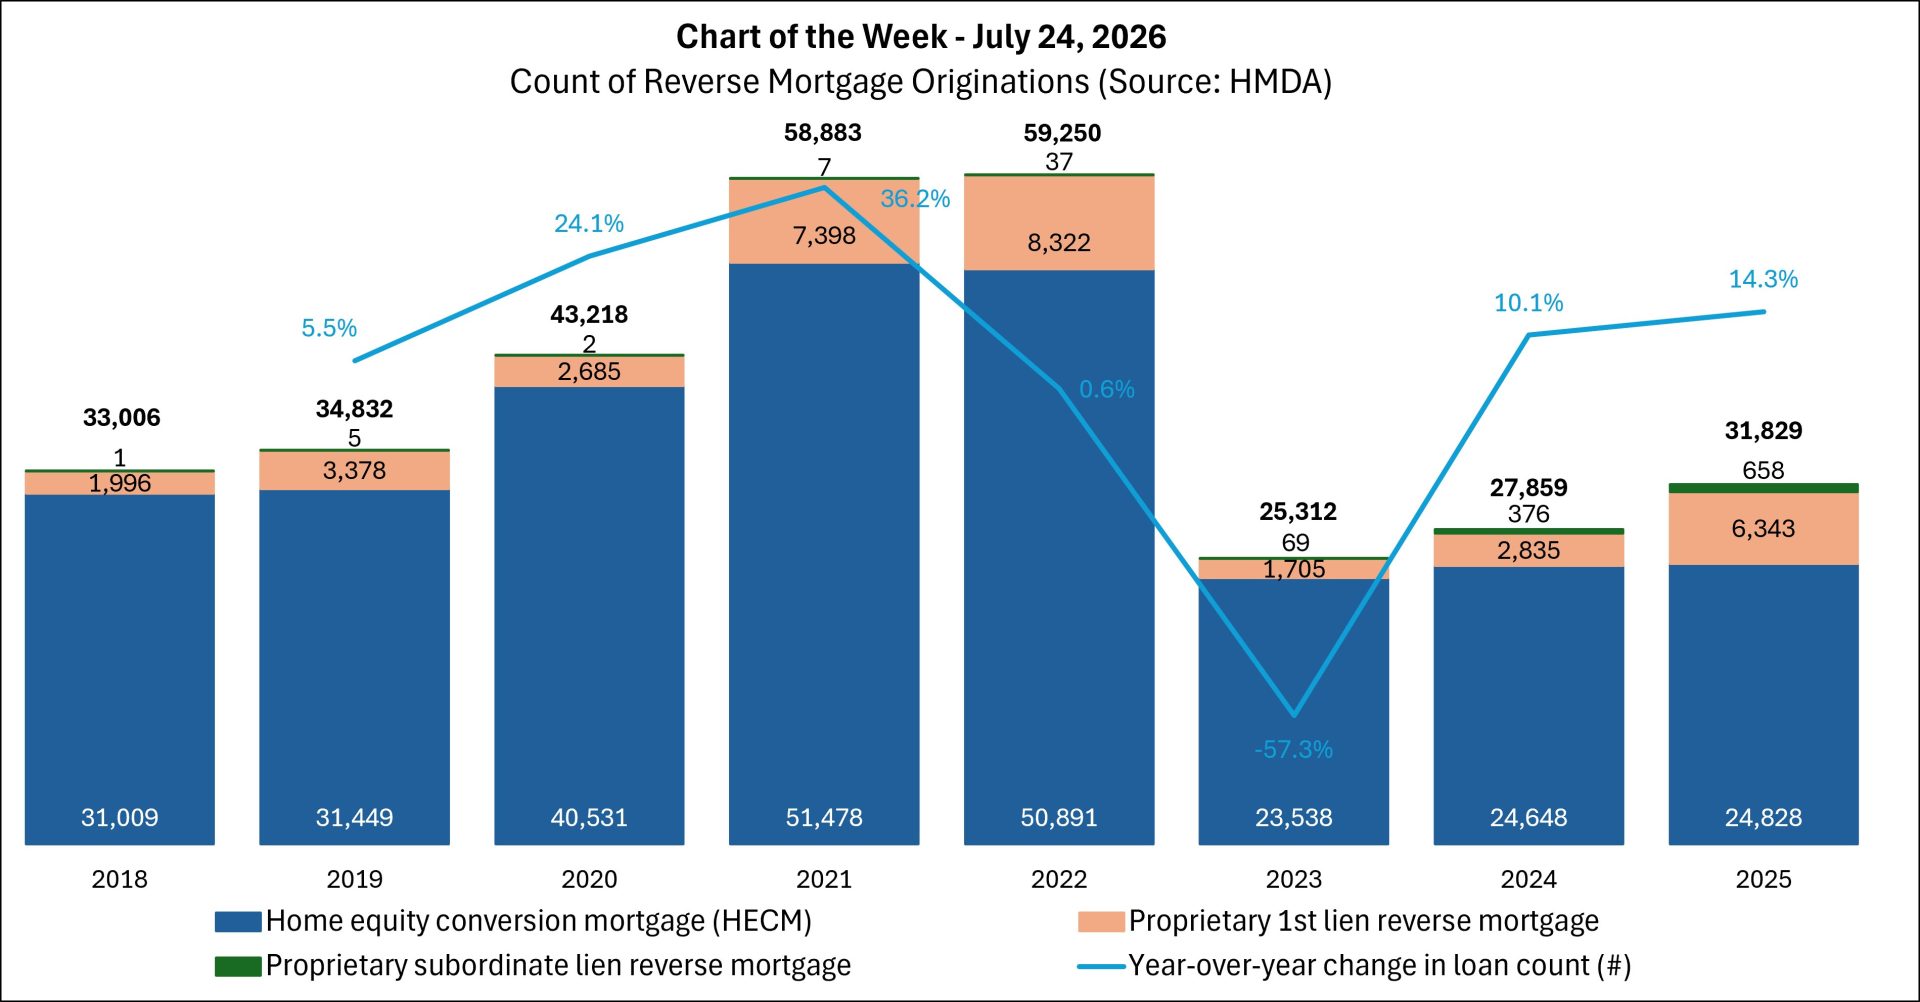
The analysis highlights trends in both the Federal Housing Administration’s Home Equity Conversion Mortgage (HECM) program and proprietary reverse mortgage products. While HECM originations have grown modestly since 2023, proprietary reverse mortgages have expanded at a much faster pace, significantly increasing their share of both total originations and overall lending volume. Read the full Chart of the Week to explore the data and what these trends reveal about the evolving market for senior mortgage solutions.