


You may also like

Yesterday, MBA released the latest results from its National Delinquency Survey (NDS ). Earlier in the week, the Federal Reserve Bank of New York’s Center […]
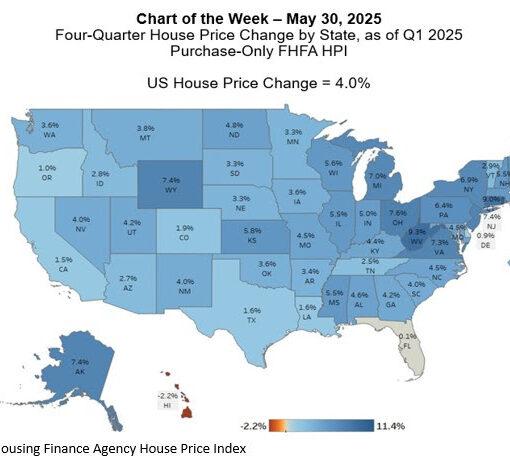
In the first quarter of 2025, U.S. house prices increased 4.0% compared to the first quarter of 2024, as reported by the Federal […]

With the arrival of a new year, new ideas and concepts come to life, paving the way for opportunities and innovative projects. […]
